
Agent Observability: You Can't Trust What You Can't Watch
- AI agent observability is the practice of tracing every step an agent takes (its instructions, tool calls, decisions, and cost) so you can debug and trust it in production instead of guessing.
- Most teams are watching the wrong layer: 89% have some observability, but only 37% actually evaluate agents on live production traffic, according to industry survey data.
- Start by instrumenting four things: the full trace of a run, every tool call with its inputs and outputs, token usage and cost, and a quality score from automated evaluation.
- Adopt the vendor-neutral OpenTelemetry GenAI conventions so your telemetry survives a change of model, framework, or backend, and turn your logs into a system you can actually operate.

The Black-Box Problem
The core problem is that an agent hides its reasoning behind a single output. You ask it to reconcile an invoice, it says "done," and you have no idea whether it read the right document, called the right tool, or hallucinated a vendor. Traditional monitoring tells you the request returned a 200 and took 4 seconds. It tells you nothing about the eight decisions the agent made along the way.
This matters more for agents than for ordinary software because an agent's failure modes are weirder. Research on multi-agent systems catalogs 14 distinct failure modes, and the largest bucket is not bad models, it is system-design failures at 44.2%, according to Deepak Gupta's 2026 market review. Inter-agent misalignment and weak task verification make up most of the rest. None of those show up in a latency chart. They show up in the trace, if you captured one.
The industry has quietly agreed on this. LangChain now frames the ability to trace multi-step reasoning chains and tool calls as "table stakes" for agents, not a nice-to-have, in its State of Agent Engineering report. When the people building the frameworks call tracing table stakes, that is the market telling you the black box is not acceptable anymore. This is the same reliability problem I wrote about in making agents reliable enough to leave alone, viewed from the instrumentation side.

What to Instrument First
Instrument four things before anything else: the full trace of each run, every tool call with its inputs and outputs, token usage and cost per run, and a quality score from automated evaluation. Those four give you the spine of AI agent observability, and you can add the fancier stuff later.
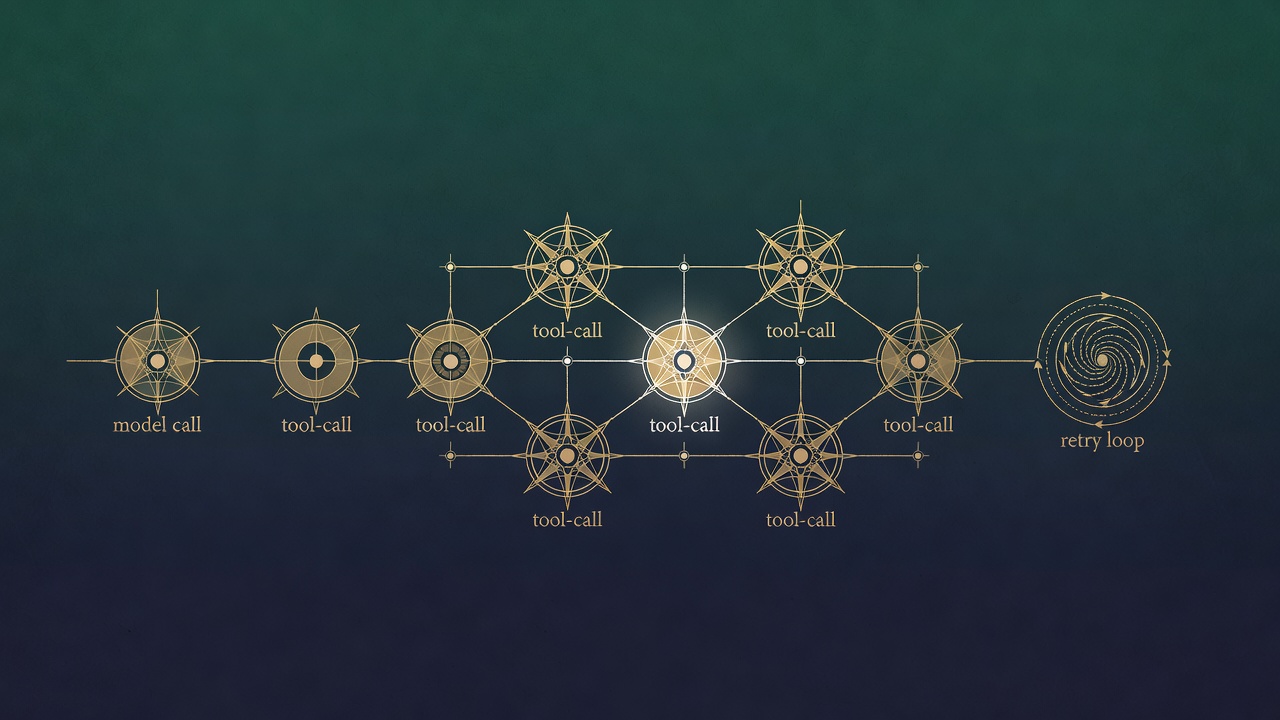
Start with the trace, because it is the backbone everything else hangs off. A trace is the ordered record of a single agent run broken into spans: the model call, each tool invocation, each retrieval step, each retry. MLflow makes the case that agent observability should be built on structured trace data rather than simple logs, recording every step from prompt to tool to final output, in its 2026 developer guide. The difference is real. A log line tells you something happened. A span tells you what happened, in what order, with what inputs, and how long it took.
Next, capture tool calls as first-class events, not as text buried in a prompt. When your agent calls a function, record the tool name, the arguments it passed, and the result it got back. This is where most agents actually break, and it is invisible unless you log it deliberately. The survey data backs this up: 62% of organizations have detailed tracing of individual steps and tool calls, and that rises to 71.5% among teams already running agents in production. The teams shipping real agents are the ones watching the tool calls.

Tracing a Decision End to End
To trace a decision end to end, follow one request through every span it touches and confirm each step used the right inputs and produced a sane output. This is the debugging move that turns "the agent gave a wrong answer" into "the agent retrieved a stale document on span three, so of course the answer was wrong."
Here is where a standard earns its keep. OpenTelemetry formed a GenAI working group and built vendor-neutral semantic conventions: shared span names and attributes like the operation name, the provider, the model, token counts, and dedicated tool-call fields for the tool name, its arguments, and its result. Datadog describes the point of these conventions as making AI observability "measurable, comparable, and interoperable across frameworks and vendors" in its write-up on the standard. The contrarian truth here is that the standard matters more than any single dashboard, because a shared schema means you can swap models or backends without rewriting your instrumentation or losing trace continuity.
Practically, end-to-end tracing is what makes an incident survivable. When an agent gets something wrong in production, the trace is the first artifact you open, the same way you would reach for it in an agent incident response. Without it, you are reconstructing a crime scene from a single blurry photo.
Watching Cost and Drift
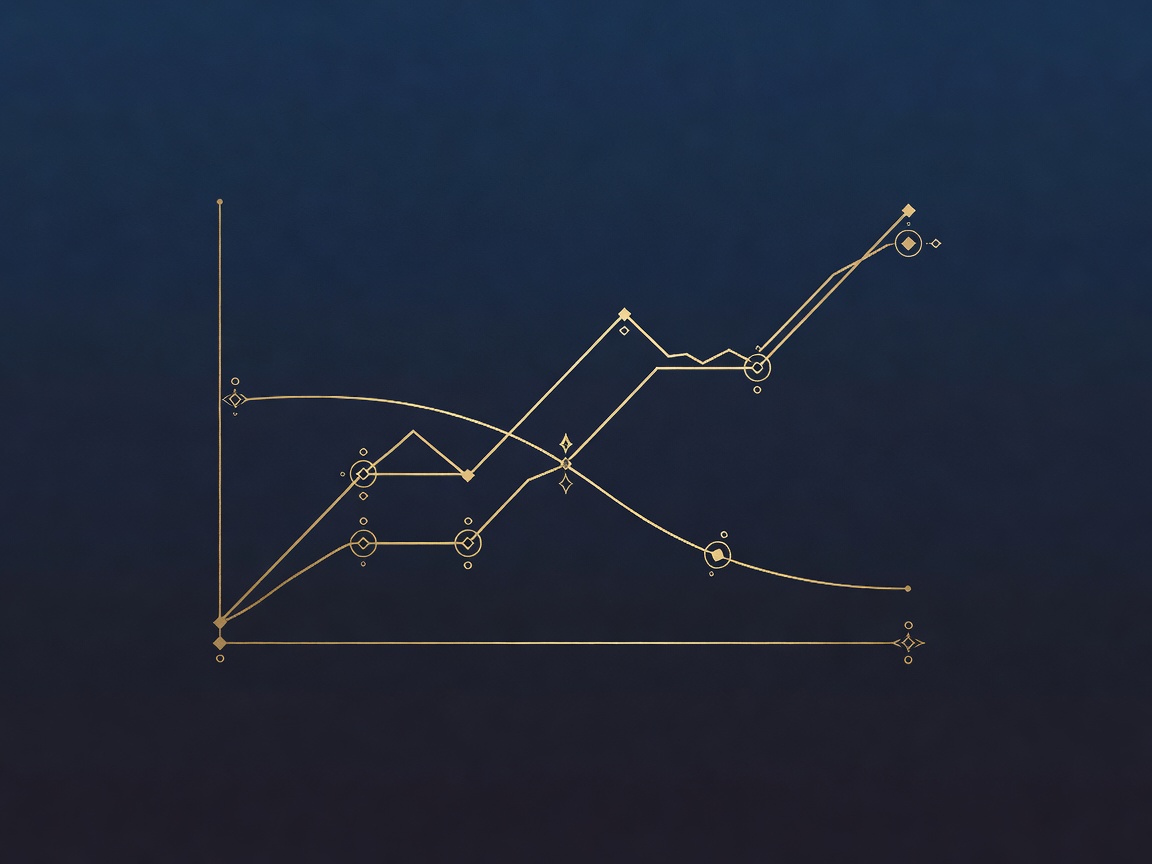
Watch cost and drift continuously, because both fail silently and neither shows up until the bill or the complaint arrives. Cost is the easy one to instrument and the easy one to ignore. Every run burns tokens, and an agent that quietly starts looping or over-retrieving can triple your spend before anyone notices. Track token usage and cost per run as a first-class metric, the way you would track a budget, which is the same discipline behind giving an agent a budget in the first place.
Drift is the harder one. An agent that was accurate in June can degrade by August because the world changed, the model was updated, or your data shifted underneath it. This is why the evaluation gap is so dangerous: only 37% of organizations run online evaluations on production traffic, versus 52% that only test offline on fixed datasets. Offline tests catch the bugs you already imagined. Online evaluation catches the ones reality invents. You need automated quality scoring on sampled real runs, plus alerting when the score slips, or you will find out about drift from a customer instead of a dashboard.
From Logs to an Operable System
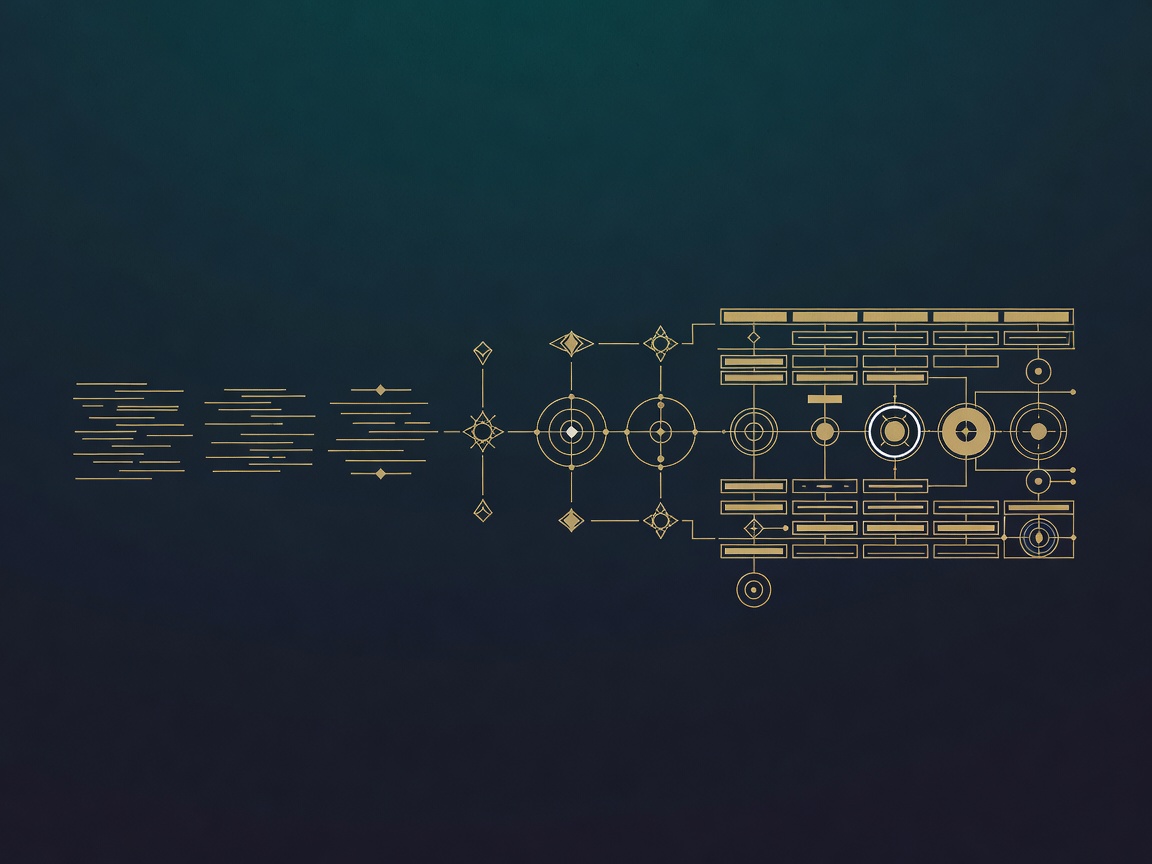
Observability converts an agent from a black box into an operable system, and that is the entire point. The market clearly agrees on the direction: the LLM observability platform category was estimated at roughly $510 million in 2024 and is projected to pass $8 billion by 2034, per figures cited in MLflow's developer guide. That is not hype money, that is infrastructure money, the kind that gets spent when something moves from experiment to operation.
An operable agent has three properties a black box does not. You can see what it did on any given run. You can prove what it did, which matters the moment a decision is questioned or audited. And you can improve it, because you have the traces and scores to know what to fix. Get there by treating observability as a build requirement, not a retrofit. Instrument the trace, the tool calls, the cost, and the evaluation from day one, standardize on OpenTelemetry so your telemetry outlives your current stack, and route the signals into alerts a human will actually see. Do that and you stop hoping your agent behaves. You start operating it, which is the only version of this that scales.
Frequently Asked Questions
What Is AI Agent Observability?
AI agent observability is the practice of tracing and analyzing how an agent receives instructions, uses tools and memory, makes decisions, and produces outputs, so teams can debug its behavior and evaluate its quality in production rather than guessing from a single final answer.
Why Is AI Agent Observability Important?
It reveals where multi-step agent workflows fail and lets teams catch latency, tool-call errors, cost spikes, and hallucinations before they reach users. Because agent failures are often design and coordination problems rather than model problems, they are invisible without a trace.
What Is the Difference Between AI Observability and AI Agent Observability?
AI observability is the broad discipline of monitoring AI systems in general. Agent observability focuses specifically on autonomous, multi-step behavior: tool use, memory, decision paths, and traceable reasoning across a whole run rather than a single model call.
What Metrics Should You Track for AI Agent Observability?
Track step-by-step traces, tool-call latency and errors, token usage and cost per run, model version, memory reads and writes, and quality scores from automated evaluation on sampled production runs.
How Do You Debug an AI Agent in Production?
Capture structured traces, correlate each tool call with its inputs and outputs along the run's timeline, and run continuous evaluation on sampled production traffic to isolate exactly which span produced the failure.